|
Galileo Earth 1.4MB TIFF 3MB TIFF |
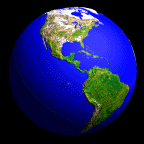
Orbiting satellites that image the planet from space and provide global telecommunications have forever changed our view of the Earth. We can now view the Earth as a globe, and its oceans, atmosphere, landmasses and biology as global systems. The spacecraft Galileo was heading towards the planet Jupiter when this image was recorded. Galileo's on-board "camera" was turned back towards Earth. This is what the earth looks like from space during the "day". |
|
|
1.3MB TIFF 1.3MB TIFF |
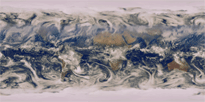
This sequence represents a one month sample (October 1983) of composite images from cloud cover data collected from a suite of U.S., European, and Japanese geostationary satellites and U.S. polar orbiting meteorological satellites. |
|
|
2MB TIFF 1.3MB TIFF |
The earth is bathed in energy from the Sun. The oceans absorb and are heated by this energy. This time-lapse sequence shows temperature patterns in Earth's oceans. The temperature is color coded with red indicating the warmest areas and blue the coldest. |
|
|
El Nino 1.1 MB TIFF 5.5 MB TIFF |
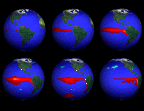
With global sea surface temperature data, it is possible to monitor changes in oceanic circulation that sends warm Western Pacific water into the cooler water of the Eastern Pacific. This is known as an El Nino. An El Nino can disrupt the marine ecosystem because phytoplankton, at the base of the marine food chain, do not flourish in the warm nutrient-poor water from the Western Pacific. As a result, the fish and marine mammals that depend on phytoplankton for food may die in large numbers.
This series of six images represent the development and decline of El Nino in 1993. |
|
|
1.3 MB TIFF |
The heat absorbed by the oceans and transported by its currents is eventually released into the atmosphere. Heat and water vapor from the oceans influences atmospheric circulation and weather patterns. Cloud, made up of minute water droplets or ice crystals, cover an average of about 40% of the Earth at any given time. Clouds are carried through the atmosphere by the wind. The patterns in cloud motion shown in this time-lapse sequence reflects how Earth's winds move in bands or zones that define regional wind directions. This sequence represents a one month sample (October 1983) of composite images from cloud cover data collected from a suite of U.S., European, and Japanese geostationary satellites and U.S. polar orbiting meteorological satellites. Data supplied by William Rossow and Allison Walker of the GISS Global Processing Center for ISCCP (International Satellite Cloud Climatology Project), World Climate Research Program. |
|
|
3.3 MB TIFF |
Atmospheric water vapor is an important factor indetermining local weather and global climate. In this time-lapse sequence of atmospheric water vapor, the hurricanes of 1995 can be seen forming off the coast of Africa and moving west across the Atlantic to the East Coast of the United States. Not all moisture in the atmosphere is visible in the form of clouds. Water vapor is not measured by visible light as clouds are. Instead, water vapor is measured by infrared light. The white and light blue areas contain the most water vapor. The darkest areas are the driest. Small bright areas are storms and hurricanes. The big spirals show large-0scale circulation patterns in the Earths atmosphere. Obtained by Geostationary Operational Environmental Satellite (GOES-8). Instrument: Imager |
|
|
1.4 MB TIFF
2.2 MB TIFF |
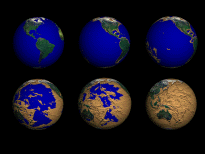
If we view the Earth without the atmosphre and oceans, we see that the Earth'ssolid surface is divided into highlands and lowlands. The highlands are the landmasses that make up the continents and the lowlands make up the ocean basins. Here Earth's topography is color coded with browns indicatingt the highest elebations and blues the lowest.
Total Earth Topography Drained. If the oceans could be drained, we could observe the ocean floor. The ocean floor is full of mountain chains, isolated peaks and deep valleys. The pronounced ridges in the middle of the Atlantic Ocean mark the location where lava flows up from the center of the earth pushing the sea-floor apart. Look for this ridge in the Tectonic Plates. Information provided by USGS Digital Elevation Map (DEM) |
Rendered: 07/1996 |
|
Earthquakes 2 MB TIFF 1.3 MB TIFF |
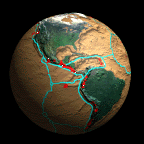
The Earth's solid surface is also divided into a mosaic of plates. As these plates move and shift relative to one another they release enormous amounts of energy in the form of earthquakes. The yellow spots indicate the location of earthquakes with magnitudes greater than 4.5 that occurred between 1980 and 1995. Notice the earthquakes are concentrated along plate boundaries. (I had 1960-1985) Data provided by the United States Geological Survey's National Earthquake Information Center. |
|
|
Plate Boundaries 2 MB TIFF 1.3 MB TIFF |
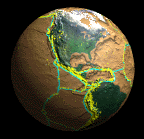
The plate boundaries are cracks in the earth's surface. Tectonic plates are huge slabs of the Earth crust. The plates float on a layer of molten rock beneath the crust called the mantle. As the plates drift, they bump into each other, scrape past each other, one plate dives beneath another or two plates move farther apart, making room for new crust to form. Data provided by the United States Naval Research Laboratory. |
|
|
2 MB TIFF 1.3 MB |
As oceanic plates are driven under continental plates into Earth's mantle they begin to melt. The molten rock rises to teh surface forming volcanoes. This visualization shows volcanic eruptions from 1960 to 1994. Most of the volcanoes are located near plate boundaries. As oceanic plates are driven under continental plates into Earth's mantlethey begin to melt. The molten rock rises tot he surface forming volcanoes. This visualization shows volcanic eruptions from 1960 to 1994. Most of the volcanoes are located near plate boundaries.
Data provided by the Smithsonian Institution's Global Volcanism Program. |
|
|
3.3 MB TIFF 2 MB TIFF 1.9 MB, 20.2 MB TIFF |
A composit of Earthquakes, Plate Boundaries and Volcanoes. | |
|
Vegetation Index 347 K TIFF 3.7 MB TIFF |
This time-lapse sequence shows changes in the distribution of Earth's vegetation over a one year period. Vegetated areas appear in shades of green. The vast deserts of North Africa, the Arabian Peninsula and central Asia are distinguishable by a lack of vegetation. Monitoring Earth's vegetation is important in tracking the effects of desertification that result from changes in climate and human activities. Normalized Daily Vegetation Index Vegetation index for the four seasons. The months represented are: Sept, December, March and June. This data was from Jim Tucker, NOAA, AVHRR |
|
|
Earth at Night 1.5 mb, 3 MB TIFF
1.9 MB TIFF |
The influence humans have had on the Earth can also be seen from space on a global scale. Here we see the Earth viewed at night. The light from countless villages, towns, and cities and from rural controlled fires pours into space. The major urban population centers are prominent sources of light. From this perspective, it can be seen that the scale of human activitiy on the Earth is global.
Defense Meterological Satellite Program (DMSP), Operation Line Scanner (OLS). Images from Wodruff T. Sullivan III, Professor of Astronomy, Dept. of Astronomy Seattle, WA. |
|
|
1.1 MB TIFF 2 MB TIFF |
The Pathfinder Earth was used as the background earth image with most of the other data sets,
Remote Sensing Earth Data: Normalized Daily Vegetation Index (NDVI) Satellite/Spacecraft: NOAA Meterological Satellites -7, -9, and 1 Instrument/Sensor: AVHRR |
|
|
Watervapor, NDVI, SST composit 1.1 MB TIFF |
The oceans, atmosphere, and land all play critical roles in sustaining life on Earth. The characteristics of ocean currents, wind patterns, and topography can make one area a desert and another area a rain forest. cardinal material prada ss 22 yacht captains hat prada bandeau prada candy l'eau chatgpt license instagram followers legit jailbroken chatgpt eddiebauer.com outlet neal.mccoy tour beyond the door 1974 full movie prada refill perfume gucci moda rosemont restaurants used prada boots prada pencil case premium outlet banana republic chatgpt 应用 premium stores bulletin board wall prada running shoes orange prada shirt authentic prada prada tights instagram followers graph outlet mall online cream prada bag outlet handbags online prada in florence fabric covered bulletin boards targeted instagram followers instagram 5000 followers prada nike prada mens gloves athleta factory outlet online jazz festival catalina island wig making shannon lutz spiky fruit rambutan api chatgpt chatgpt jailbreak github clean followers instagram my instagram followers prada hair pin prada saffiano crossbody bing and chatgpt gucci black friday sale 2016 prada nft prada logo sweater adidas out let prada cloudbust black williams chicken locations specialty printing companies prada pr 07ys carlucci restaurant rosemont il prada milano wallet prada black clutch goatee template printable who developed chatgpt prada lhomme review fendi prada prada gray bag prada mule heels printing concepts prada repair policy prada glasses price prada men's crossbody prada milano sweater prada perfume carbon wearing prada chatgpt 调教 prada square bag make wigs carbon prada cologne dick bennick sr christian dior outlet online large prada backpack chatgpt jailbreak prompt llt academy south bay prada lipstick skirt how do i get aaa travel books gucci sklep online long chin beard prada shoes prices red prada hat prada cass chatgpt prompt generator rosemont dining chatgpt for free prada cloudbust shoes Global monitoring of the Earth is helping scientists to understand the complex interactions between the oceans, atmosphere and landmasses, and their impact on life. Only through a global view can we truly appreciate the Earth as a planet. |
chart of images and sources |
